Kennis
How do you read a tide table?
Gepubliceerd op
1/1/2026
When you want to sail around the coast of the Netherlands, you'll have to be aware of the tides. But what is an astronomical tide? And how can you gain useful tidal information for your trip to the Netherlands?
Diese Informationen sind auch auf Deutsch verfügbar.
Deze informatie is ook beschikbaar in het Nederlands.
Wat is an astronomical tide?
Dutch waters are tidal, with two high tides and two low tides occurring approximately every 24 hours. The state of the tide and the tidal movements are caused by a combination of three effects:
- the rotation of the earth around the sun;
- the effects of gravity on the earth;
- the moon’s gravitational pull on the water.
An astronomical tide, more commonly known as ebb and flow, is the result of this combination of effects.
The weather and the positions of the sun and the moon can have further effects on astronomical tides, causing differences in water depth, tidal current rate, and even the shape of the coast.
Spring tide and neap tide
High and low tides occur daily. In addition, there are monthly spring and neap tides. When the sun and moon are aligned, their gravitational pull on the earth increases. This happens during full and new moons. About two days later, a spring tide occurs: the high waters are then higher than average, and the low waters lower than average.
The reverse is also possible. This is known as neap tide. In this case, the sun and the moon are at right angles to each other, and the water is pulled from two different sides. This occurs during the first and last quarters of the moon (crescent moon). The effect of this, neap tide, is noticeable a few days later. High tides are then lower than normal, and low tides are higher than normal. The difference in tides is therefore smaller.
Tidal divide
A tidal divide occurs between an island and the coast, where two tidal currents meet. This also applies to the Wadden Sea. The tide first rises on the west side of the Wadden Islands, and then soon after on the east side. These two tidal waves then meet behind the islands, where it is sheltered and there is little current. This results in an accumulation of silt, giving rise to a shallow area. It is important to keep this in mind.
Predicting the tides
Tides move along the North Sea coast. This means that high and low tides do not occur at the same time everywhere. When sailing at sea, it is essential to have data on times, high and low water levels, and tidal currents and their strength.
Fortunately, astronomical tide forecasts can be very accurate. The data can be read in tables, such as tide tables and tidal current atlases. NB: weather conditions can cause differences between astronomically predicted water levels and the actual measured water levels.
Official information: NLTides
The Hydrographic Service, which is part of the Royal Netherlands Navy, provides up-to-date tide tables, for example in NLTides. NLTides contains the official digital information on water levels and currents along the Dutch coast. The digital version, HP33D, is more comprehensive than the paper version, HP33. As of 2025, the software can be downloaded free of charge, and you can use it entirely independently.
The information is provided by the Hydrographic Service and the Directorate-General for Public Works and Water Management (Rijkswaterstaat). A wide range of apps are currently available that make it very easy to obtain information on tides. This is very convenient, of course, but it can be more satisfying and educational to be able to read a tide table yourself. In addition, you should keep in mind that the apps do not always keep up with updates issued by the Hydrographic Service. With NLTides, you can be sure that you have the most up-to-date information.
That is why this article refers to the NLTides program with regard to checking water levels and currents along the Dutch coast. Each version predicts one calendar year. You can therefore look up water levels up to 31 December of the current year, making it even easier to prepare for your trip.
Everything relative to the ALAT
Once you have downloaded NLTides, you can start the program yourself. In this article, we will explain the most important abbreviations to make sure that you understand the basics of reading tides.
On Dutch inland waterways, we use the NAP (Normaal Amsterdams Peil, or Amsterdam Ordnance Datum) to measure water levels. At sea, we use the ALAT (Approximate Lowest Astronomical Tide) as chart datum to determine water depths. This is the lowest possible water level based on the positions of the sun and the moon.
Water levels below the ALAT also occur, for example due to weather conditions such as high air pressure or an offshore wind. All the figures in NLTides are relative to the ALAT. And it is important to keep the ALAT in mind in relation to your own boat. You must make sure that there will be enough water under your keel with regard to the tides. That is one of the reasons you should always check the tides before embarking on a trip.
How to read a tide table
The map in NLTides shows various ports, which are indicated by red blocks. Next to most of the red blocks, you will see a red minus or a green plus sign, indicating whether the tide is rising (flood) or falling (ebb) in that area.
When you click on a port on the map, a smaller screen pops up, containing several tabs with extra information. The second tab, HWLW, contains information on high water / low water. These tables, also called tide tables, show the highest and lowest water levels relative to the ALAT for the date you entered and the following five days.

The above tide table gives the high and low water times per day. The depths are shown relative to the ALAT chart datum.
Determining safe times for your trip
A tide table is useful, but it is, of course, best if you can check when it is safe for you to sail in a particular area in your situation. In order to look up specific information regarding your own boat, you first have to fill in some details.
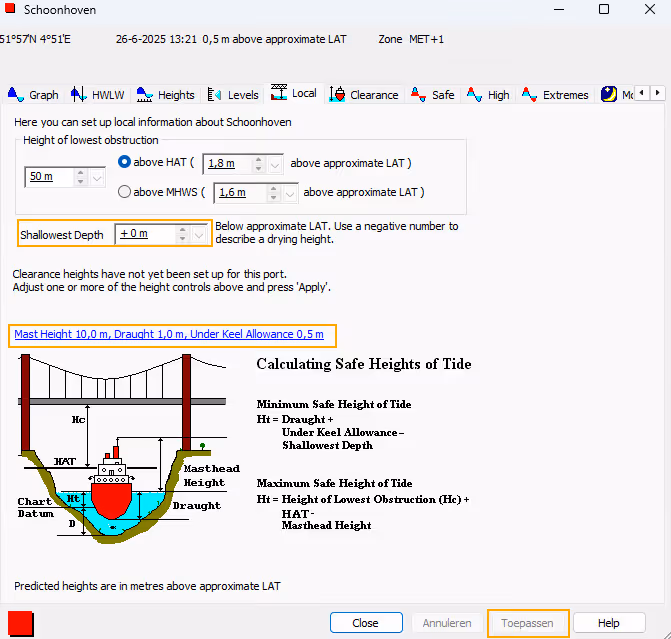
Go to the ‘Local’ tab for the port in question and start by entering a number for ‘Shallowest Depth’. Just underneath, you will see the link: "Mast Height, Draught, Under Keel Allowance." Click on the link to enter the details of your vessel.
Once you have entered all the details, click Toepassen (Apply) at the bottom to see the specific results. (Keep in mind: you have to enter the Shallowest Depth for each port to retrieve the specific data).
How to read a tide graph
The first tab is entitled "Graph". This is the tide graph. You can select ‘duration’ at the bottom right to set a duration from 3 hours to 31 days. (As standard, the duration is one day.) If you filled in Shallowest Depth and the details of your vessel in the previous step, you can now see when it is safe for you to sail in the area.
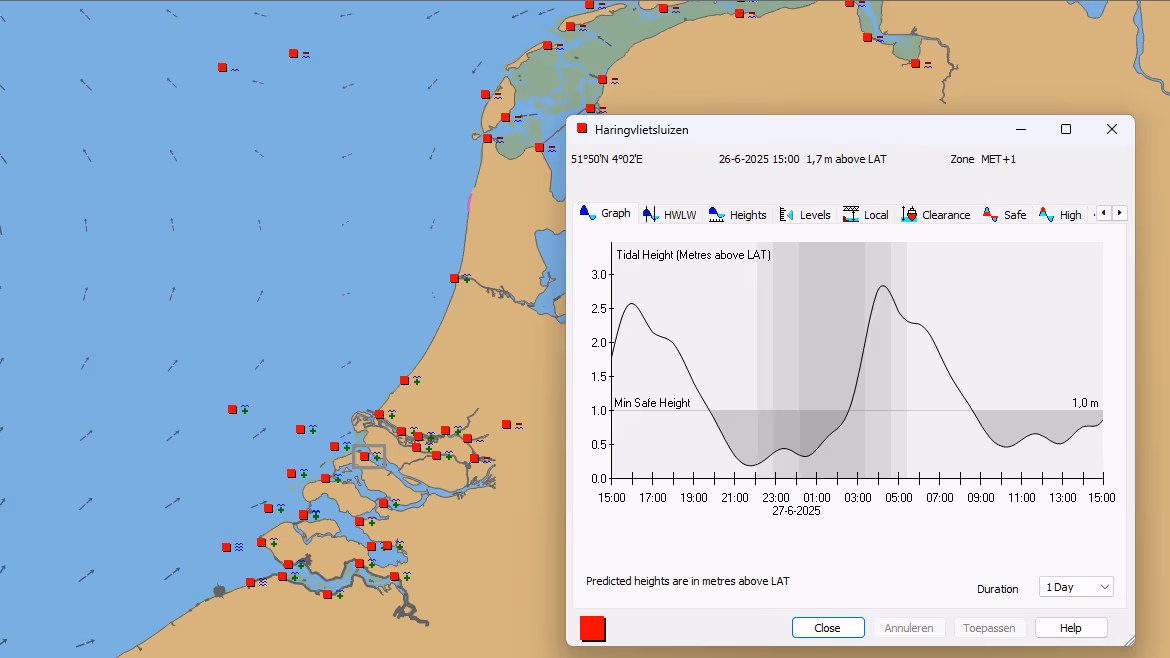
In the above image, we have used Haringvlietsluizen (Haringvliet sluices) as an example. We are looking for information for a sailing boat with a draught of 1.50 metres. Anything above ‘Min Safe Height’ is a safe time to sail for this vessel.
The graph shows that the ship has enough depth to sail here on 26 June 2025 until 18.50. After that, the water becomes too shallow. From 3 o'clock at night until about half past eight in the morning, the boat can sail at the Haringvliet sluices again. You will also find these figures accurately displayed in the ‘Safe’ tab.
Tidal current atlas and other data
If you want to learn more about this subject, we have provided an additional article in English regarding tidal current atlases and other astronomical data. This valuable data is incorporated into the NLTides software, up to the entire current calendar year.
Blijf op koers!
Sluit je ook aan bij meer dan 10.000 abonnees en ontvang maandelijks de gratis nieuwsbrief met nautische tips en informatie.
The Hydrographic Service of the Royal Netherlands Navy produces nautical charts, accurately defines the Dutch maritime boundaries, performs depth measurements, and publishes weekly Notices to Mariners (NtM). This is how the naval service contributes to safe boating.